
How to Calculate a Product Carbon Footprint under ISO 14067
How to calculate product carbon footprint is a question finance and sustainability teams increasingly ask together, not separately. A product carbon footprint (PCF) quantifies the greenhouse gas emissions associated with a single product across some or all of its life cycle. Done well, it draws on life cycle assessment (LCA) principles, defined system boundaries and traceable primary data. Done poorly, it produces a number nobody can defend under scrutiny. This article walks through the mechanics practitioners actually use, following the international standard ISO 14067, which sits alongside the broader LCA standards family including ISO 14040 and ISO 14044.
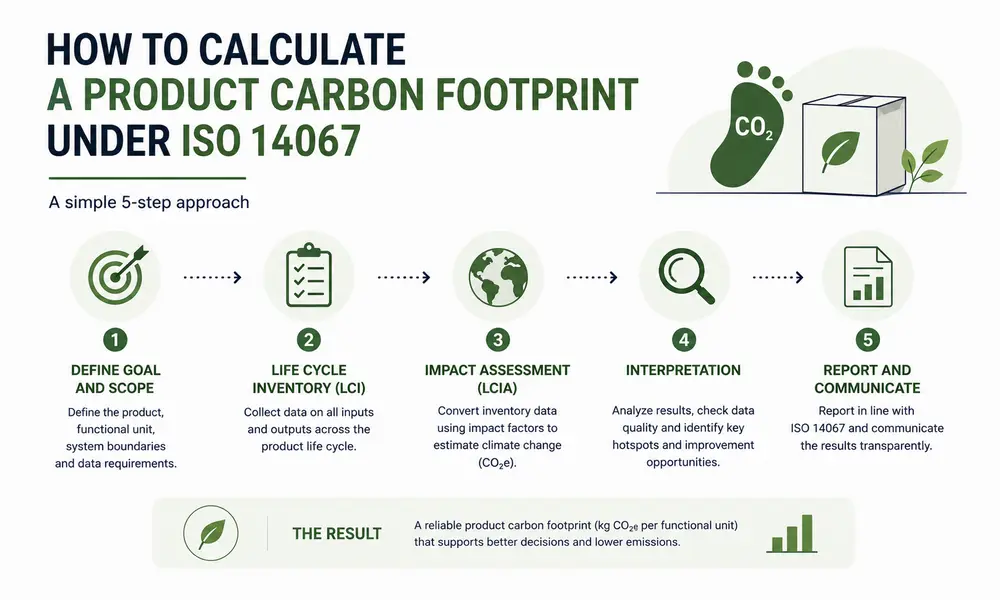
How to Calculate Product Carbon Footprint: Goal, Functional Unit and System Boundary
Every credible PCF study starts with a written goal and scope definition. Skipping this step is the most common source of later disputes with customers, verifiers and regulators.
- Define the goal: internal decision support, customer disclosure, a CBAM embedded emissions declaration or an Environmental Product Declaration (EPD).
- Set the functional unit or declared unit, such as “1 kg of finished steel coil” or “1 litre of packaged beverage delivered to distributor”.
- Choose the product system boundary: cradle-to-gate covers raw material extraction through the factory gate, while cradle-to-grave adds distribution, use and end-of-life stages.
- Document exclusions and cut-off criteria, stating the threshold applied and justifying each excluded flow.
- Record the reference period, geographic scope and technology represented by the data used.
Boundary choice is not cosmetic. A cradle-to-gate figure prepared for CBAM purposes measures something distinct from an EPD figure covering full life cycle modules, and both differ from an organisational inventory boundary used for corporate reporting. Confusing these boundaries undermines credibility with customers and regulators alike.
Primary Data and Emission Factors
ISO 14067 expects a clear data hierarchy: use primary data for the processes a company owns or controls, and secondary emission factors only where primary data is genuinely unavailable.
- Collect primary data from metered energy use, fuel consumption, purchased material quantities and process records.
- Map each material and energy input to the relevant unit process within the product system.
- Select emission factors from recognised, documented databases for upstream flows lacking supplier-specific data.
- Apply consistent units, reference periods and global warming potential values across all inputs before aggregation.
- Flag data quality for each flow, noting whether it is measured, calculated or estimated, and record the source.
Suppliers who can provide their own verified PCF figures materially improve the accuracy of a downstream calculation. This is why structured supply-chain engagement, not desk research alone, drives PCF quality over time and reduces reliance on generic averages.
ISO 14067 Within the Wider LCA Standards Family
ISO 14067 builds directly on the LCA framework set out in ISO 14040 and ISO 14044, adapting it specifically to quantify greenhouse gas impacts rather than the full multi-category impact profile of a general LCA. The standard, published at ISO’s own standard page, specifies requirements for goal and scope definition, inventory analysis, impact assessment using global warming potential factors, interpretation and reporting content. It is a quantification and reporting standard, not a certification scheme, and it does not declare a product “carbon neutral” — practitioners should avoid that framing entirely. The methodology instead produces a quantified, auditable figure that can be tracked against a defined baseline or used in disclosure, provided the boundary, allocation rules and data sources are transparent.
Our detailed walkthrough of boundary-setting and evidence expectations under this standard is covered in the ISO 14067 Carbon Footprint guidance, while broader calculation mechanics are addressed in our Product Carbon Footprint resource.
Feeding CBAM Declarations and EPD Programmes
A verified product carbon footprint is not an isolated exercise: it supplies the embedded emissions data that CBAM declarants must report, and it supports Environmental Product Declaration (EPD) programmes built on life cycle data. CBAM applies to imports of covered goods — iron and steel, aluminium, cement, fertilisers, hydrogen and electricity — under Regulation (EU) 2023/956. During the transitional period, which began on 1 October 2023 and runs to 31 December 2025, importers submit quarterly CBAM reports of embedded emissions with no financial adjustment due. From 1 January 2026 the definitive regime applies: only an authorised CBAM declarant may import covered goods, an annual CBAM declaration is submitted for the preceding calendar year, embedded emissions must be verified by an accredited verifier, and CBAM certificates must be surrendered against the declared emissions. Actual, verified installation-level data is the expected basis for definitive-period declarations; Commission default values may be used only within the limits set by the Regulation and its implementing acts. Readers working directly with these obligations should consult the official text of Regulation (EU) 2023/956 on EUR-Lex and the European Commission’s CBAM information page.
The same underlying activity data, emission factors and system boundary logic also feed EPD programmes, which require life cycle-based, independently verified environmental data prepared to programme-specific product category rules — EN 15804 for construction products, for example. The dual application saves companies from rebuilding the same footprint twice for different audiences, but the boundaries are not interchangeable: CBAM embedded emissions follow the Regulation’s own production-process and precursor rules, while an EPD follows its programme’s module structure. Each must be checked against its own rules, allocation methods and cut-off criteria before reuse.
Our companion article on CBAM Embedded Emissions: How to Calculate Them Correctly covers that regulatory reporting layer in detail.
Worked Example: Building a Cradle-to-Gate Figure
The following example is illustrative only. It uses simplified, hypothetical figures to show the arithmetic logic and does not represent measured data, real emission factors or results from any client.
Assume a functional unit of 1 tonne of finished product with a cradle-to-gate boundary.
- Raw material input: 1.2 tonnes of precursor material at an illustrative factor of 0.8 tCO2e per tonne = 0.96 tCO2e.
- Purchased electricity: 500 kWh at an illustrative grid factor of 0.4 kg CO2e/kWh = 0.20 tCO2e.
- On-site fuel combustion: 100 litres of diesel at an illustrative factor of 2.68 kg CO2e/litre = 0.27 tCO2e.
- Inbound transport of materials: 0.15 tCO2e derived from distance, mass and load factor.
- Sum the flows: 0.96 + 0.20 + 0.27 + 0.15 = 1.58 tCO2e per tonne of product.
That total becomes the cradle-to-gate PCF for the declared functional unit, subject to data quality review, sensitivity testing on the dominant flows and, where required, independent verification. In this illustrative case the precursor material drives roughly 61% of the result, which is where a management team would focus reduction effort first.
Verification and Evidence
A calculated PCF is only as strong as the evidence trail behind it. Zero Emissions Hub prepares product carbon footprint calculations in line with ISO 14067, supported by documented activity data, emission factor sources, allocation choices and boundary justifications. We act as consultants, not as an accredited verification body; independent verification is carried out separately by qualified third-party verifiers. Where a formal EPD or a definitive-period CBAM declaration requires external verification, we prepare the underlying data package so it withstands that review without rework.
How We Work and What You Receive
Engagements typically begin with a scoping call to confirm the goal, functional unit and intended use of the figure. We then map data availability, identify gaps requiring supplier engagement, build the calculation model and test the sensitivity of the result. Clients receive a documented PCF report, an emission factor register, a boundary and assumptions log, and a data quality summary suitable for internal sign-off or handover to an external verifier. From there, the causal path continues into management action: hotspot flows become reduction targets, and progress is re-measured against the original baseline.
Where relevant, we align outputs with circularity indicators referenced in our ISO 59004 guidance and the broader EU Framework for Circular Economy, since material efficiency and footprint reduction are closely linked. The European Commission’s own strategy, set out on its circular economy action plan page, provides the policy context for that connection and for building a circularity roadmap alongside the footprint work.
Frequently Asked Questions
What is the difference between a product carbon footprint and a corporate carbon footprint?
A product carbon footprint covers one product’s life cycle emissions per functional unit; a corporate carbon footprint covers an entire organisation’s Scope 1, Scope 2 and Scope 3 emissions across all activities in a reporting year. The boundaries are different in kind and the two figures are not interchangeable.
Do I need primary data for every input?
No. ISO 14067 requires primary data where processes are under the organisation’s control and it is feasible to collect, but permits documented secondary emission factors for upstream flows lacking supplier-specific figures. The data quality of each flow must be disclosed.
Can a simple online calculator replace an ISO 14067 study?
A calculator can provide an indicative estimate, but it rarely meets the boundary documentation, allocation and data quality expectations of a defensible PCF. Our Carbon Footprint Calculator page explains what such tools can and cannot demonstrate.
Does a lower product carbon footprint mean a product is “carbon neutral”?
No. A PCF quantifies emissions; it is not a neutrality claim, and ISO 14067 does not provide a basis for one. Zero Emissions Hub does not make neutrality claims on behalf of clients.
How does this relate to circular economy planning?
Material efficiency, recycled content and end-of-life pathways affect the footprint directly, which is why circularity roadmaps and PCF work are often developed together, as outlined in our EMF Framework for Circular Economy guidance.
Request a Product Carbon Footprint Assessment
If your team needs a defensible product carbon footprint for CBAM, EPD or customer disclosure purposes, we can help you scope the boundary, data sources and methodology. Contact Zero Emissions Hub to request an assessment or call +359 889 537 131.
Find More Similar Articles
Emission Factors Explained: How to Choose the Right Ones
Emission factors are numerical values that convert a unit of activity data, such as litres of diesel or megawatt-hours of grid electricity, into an estimated quantity of greenhouse gas emissions….
VSME Standard: Voluntary Reporting for SMEs Out of CSRD Scope
VSME standard refers to the Voluntary Sustainability Reporting Standard for SMEs, a proportionate framework companies can use when they fall outside mandatory CSRD scope. Since Directive (EU) 2026/470 narrowed the…
ISO 14064-1 Explained: Building a Compliant GHG Inventory
ISO 14064-1 is an international specification that sets out principles and requirements for quantifying and reporting an organisation’s greenhouse gas emissions and removals. It gives finance, sustainability and compliance teams…
Need practical sustainability guidance?
Talk to Zero Emissions Hub about carbon accounting, ESG reporting, CBAM and climate compliance support.